I’ve been working as a data journalist for the Sydney Morning Herald since December 2017. I worked for Newslocal & Newscorp from October 2015 – December 2017 as a data journalist and began working as a journalist as an intern at the Manly Daily in 2012, joining Newslocal in 2013.
In March 2016, I participated in the Walkley Editors Lab to find and tell stories with data where we developed a comment sweeper prototype.
Data story examples:
My stories for the Herald are available here and cover a wide range of topics, including inequality in Australia, political expenses, mass surveillance, Space explained, the great crime decline, the price fall and increase in rental property across Sydney

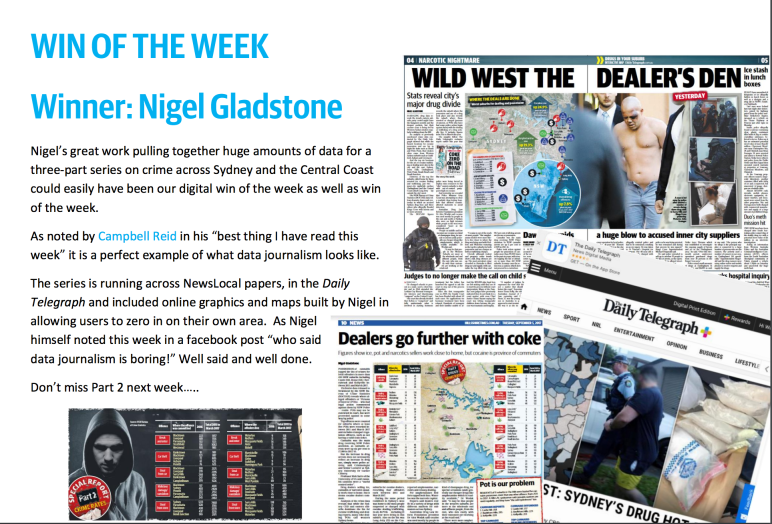
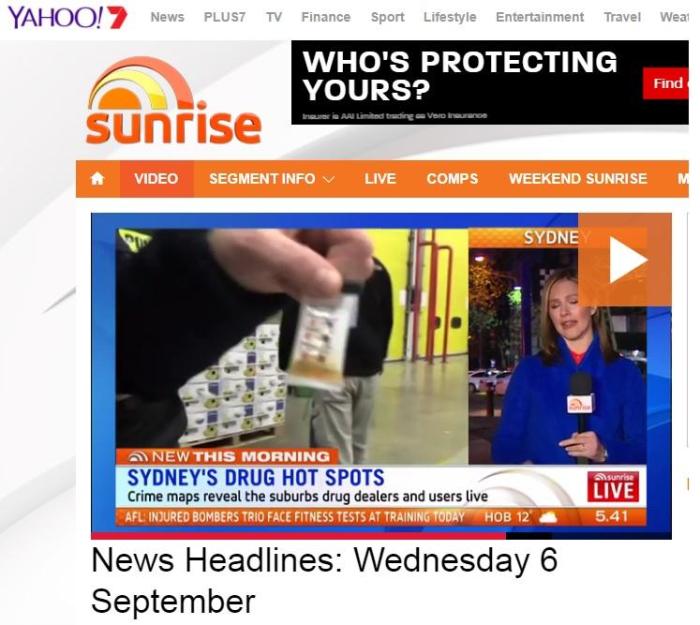
Back in August 2017 a three-part data series covering Violence, Property, and Drug crime was published online and in print for the Daily Telegraph as well as 20 local newspapers across Sydney and the Central Coast. The story was picked up by radio, and TV.
Using the FuelCheck API in September 2017, I looked at the number of times all NSW Petrol stations were updating their prices in this story. I found more than 600 stations, including one named as the cheapest in Sydney, had not updated their prices for more than a month.
In March 2017 I wrote a group story based on NSW Health statistics that found across NSW public hospitals elective C-sections are performed at about half the rate of private hospitals, who are not bound by NSW Health directives.
This story about how men go AWOL when called up for domestic duty used 2016 census data to show by postcode where chores are not a priority anymore.
I ran the numbers on participation in sport and the total amount awarded in sports grants to different codes in NSW here.
This story about hundreds of people in Sydney’s wealthy eastern suburbs paying zero net tax but claiming on average, $87,000 in deductions to manage their tax affairs used Google fusion tables (example screenshot below as fusion tables don’t like WordPress).

Domestic violence rates are officially at their lowest in NSW on the North Shore but still the women’s shelters in the area are full. My story showed ADVO and police reported assault data doesn’t always add up to easy answers.
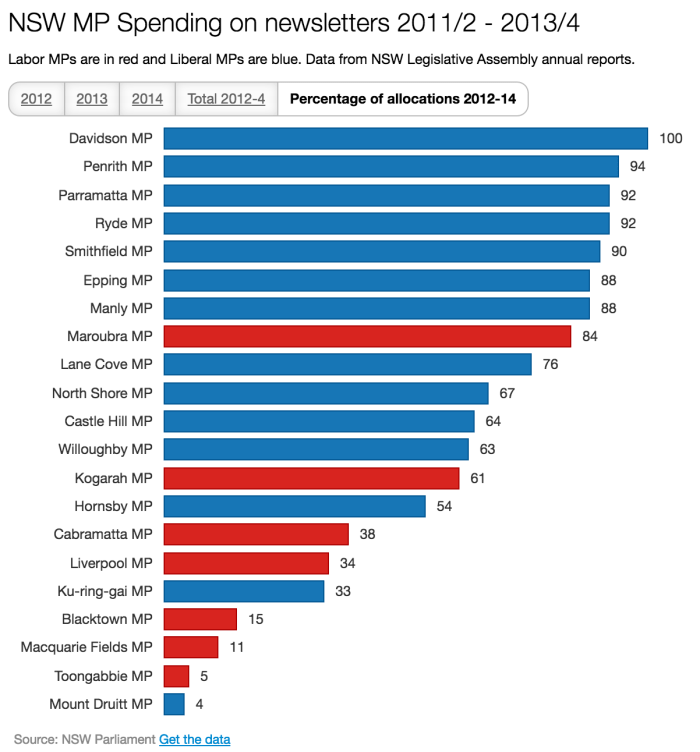
This story broke down how much state MPs spend sending newsletters.
In another article, I broke down how much local councils spend going to conferences.
My analysis of ABS statistics picked up there was a man drought on the north shore of Sydney. The story was hit on more than 10,000 times, featured a simple interactive map like below and had radio station Kiis 1065 interested.
Poker machines in NSW turnover about $70 billion, wrote a group story using data from annual reports, ABS data, welfare payments and unemployment data sources.
The amounts spent by the major parties in the 2015 NSW election campaign were detailed in this story, showing how much campaigns on the north shore cost for Liberals.